The findings at a glance
Five numbers to start with
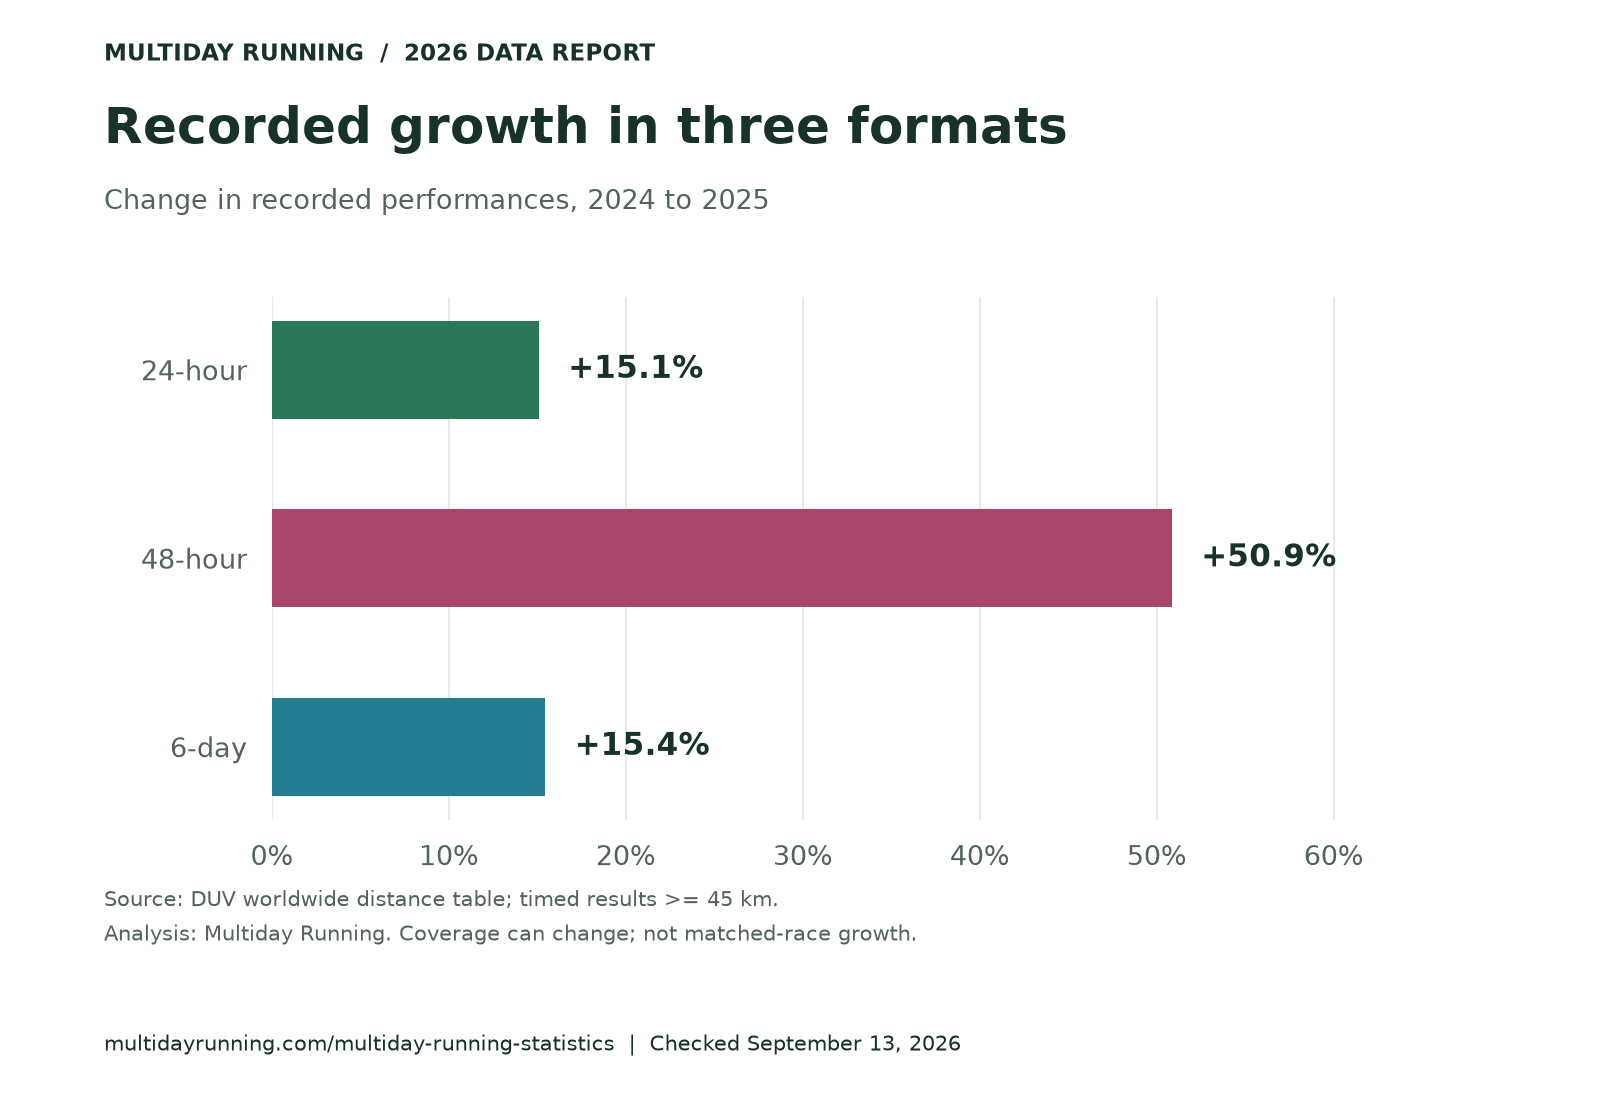
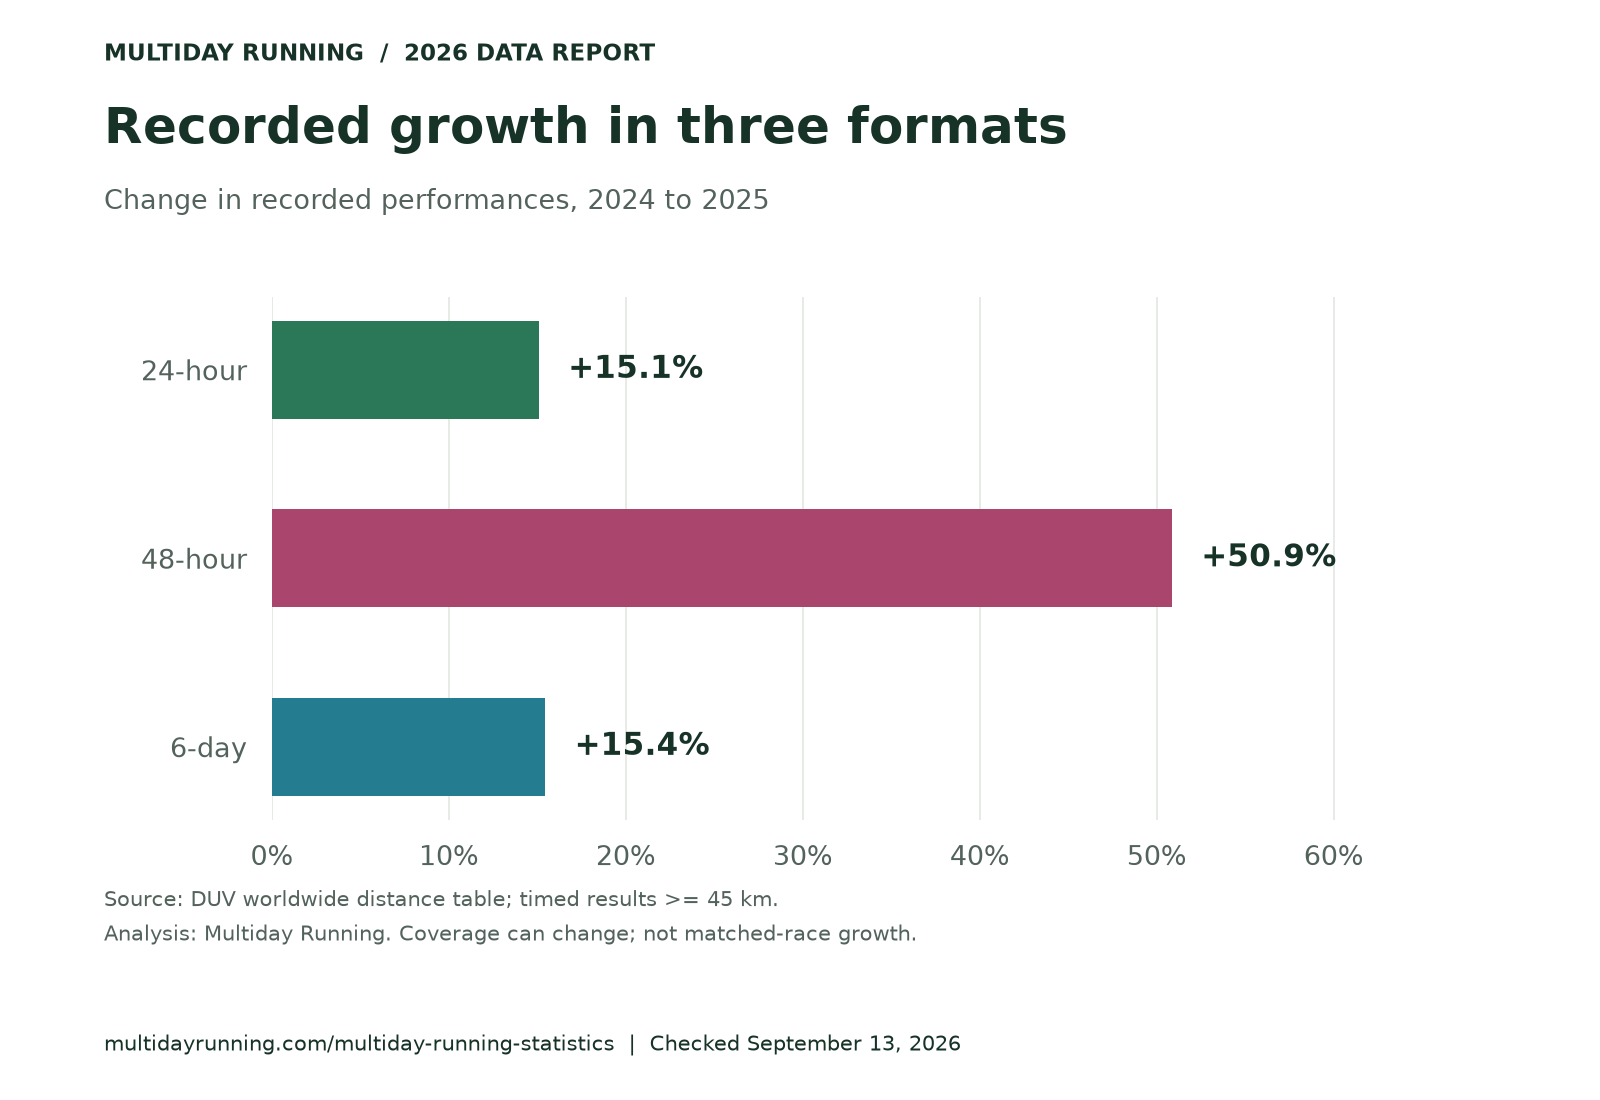
- +50.9%DUV's recorded 48-hour performances increased 50.9% from 2024 to 2025.
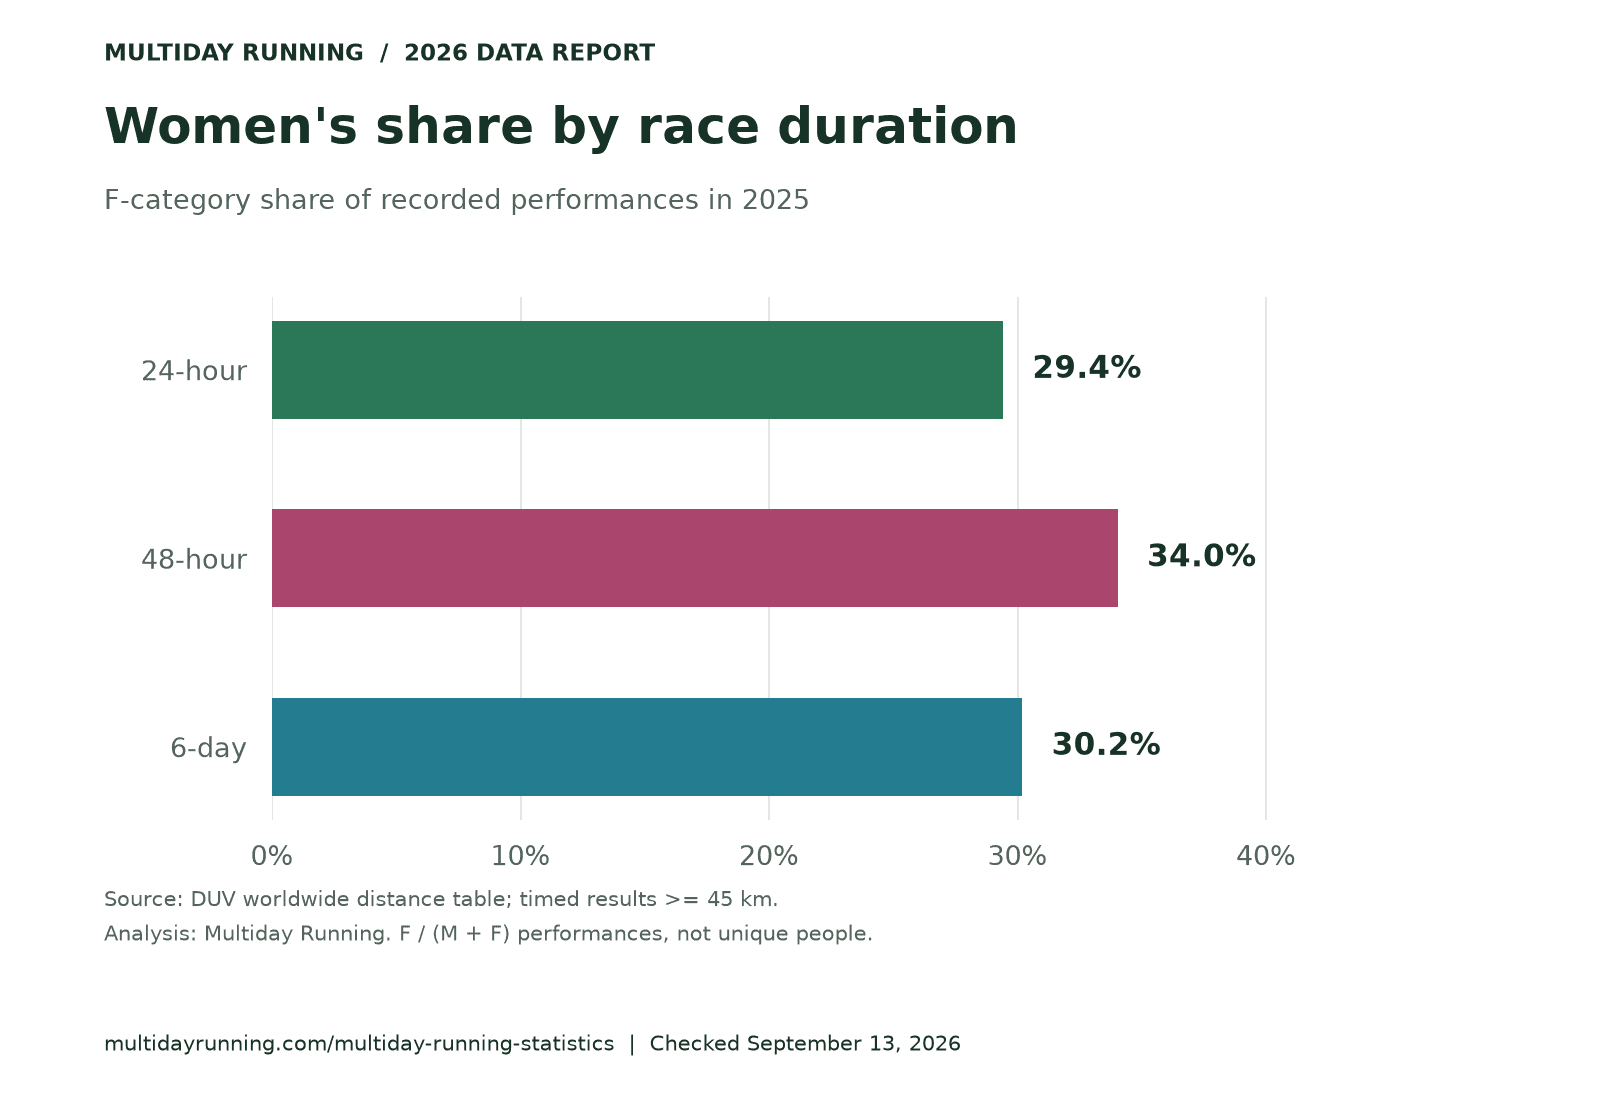
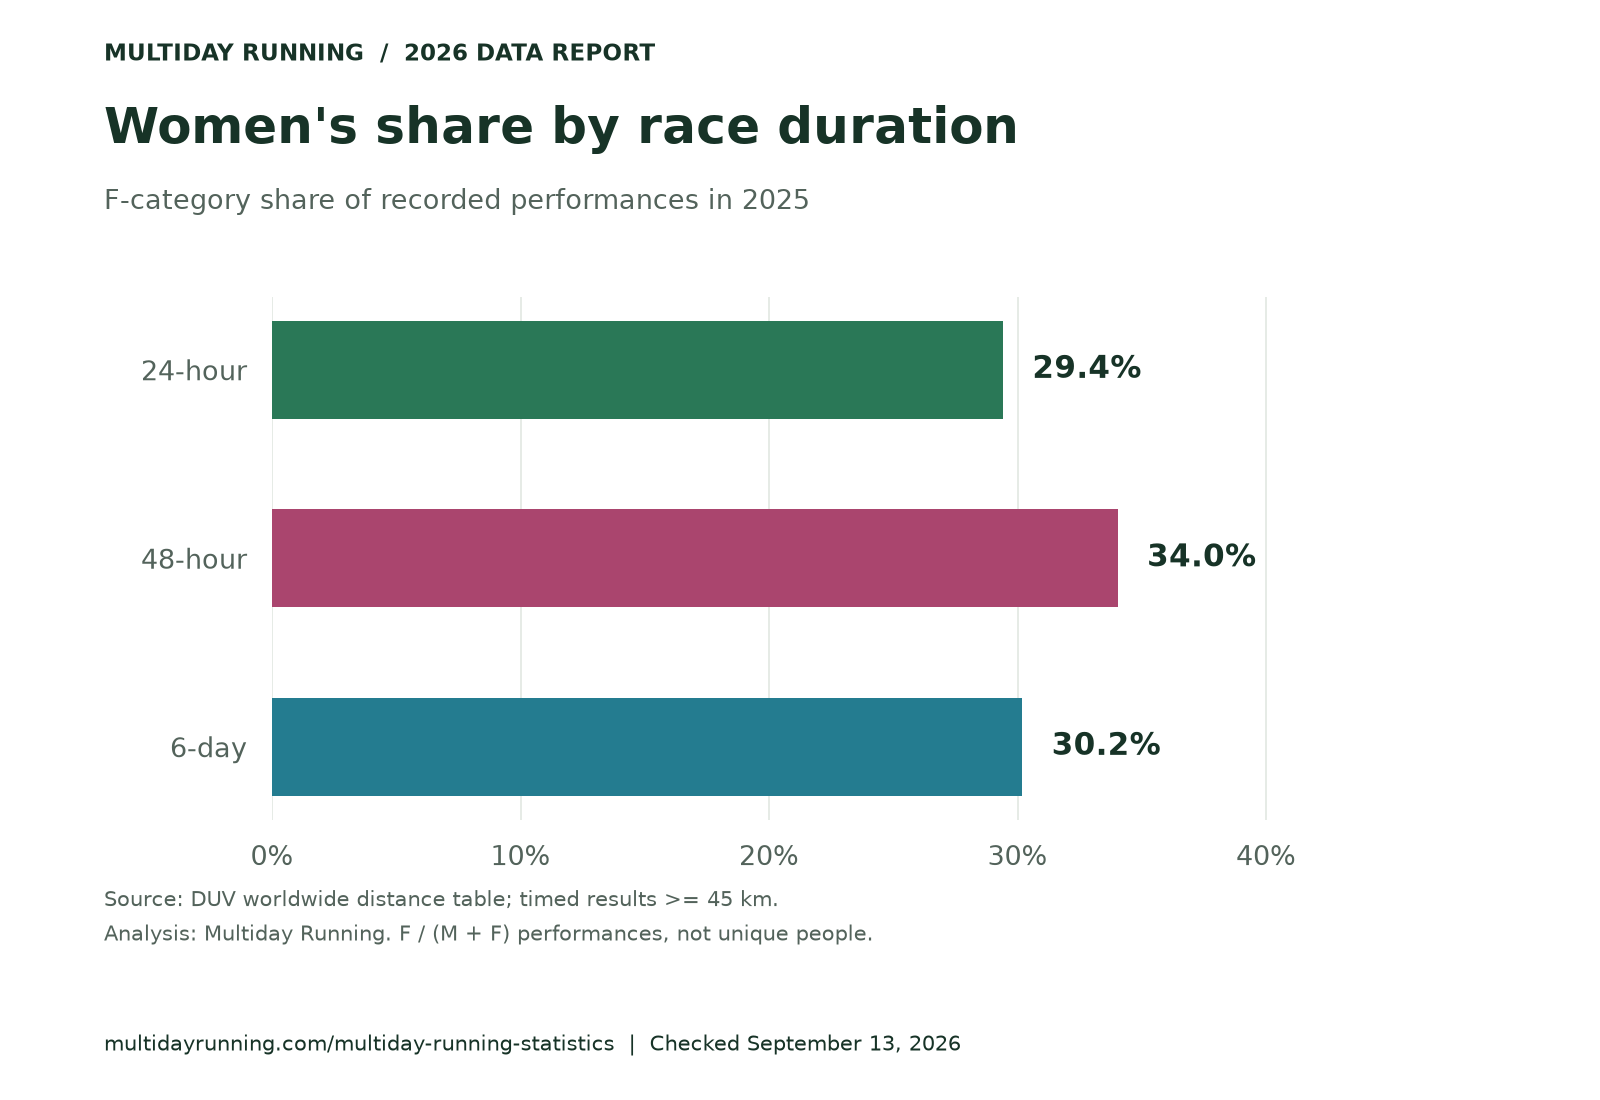
- 34.0%The F category accounted for 34.0% of DUV's 48-hour performances in 2025.
- 164.4 kmThe median distance across all 52 published London 24-hour results in 2025 was 164.4 km.
- -13.1%In the 25 Queens ten-day results from 2025, the median runner-level change in mileage from days 1-5 to days 6-10 was -13.1%.
- 11.1%8 of the 72 published Big's Backyard Ultra 2025 leaderboard results (11.1%) recorded at least 100 completed loops.
01 / Database analysis
Participation and recorded growth
The 24-hour format supplies the largest result count of these three durations. The 48-hour category shows the largest percentage increase. DUV's inclusion rules require at least 45 km for these timed formats, so these are recorded results, not counts of everyone who started. The race mix can differ between years.
24-hour performances in 2025
DUV recorded 16,685 24-hour performances in its 2025 worldwide distance table.
Calculation and scope
11,776 M + 4,909 F records.
DUV worldwide 24-hour distance-table records, subject to its 45 km minimum for these timed formats; performances can include repeat runners. Not all race starts.
48-hour performances in 2025
DUV recorded 2,462 48-hour performances in its 2025 worldwide distance table.
Calculation and scope
1,624 M + 838 F records.
DUV worldwide 48-hour distance-table records, subject to its 45 km minimum for these timed formats; performances can include repeat runners. Not all race starts.
6-day performances in 2025
DUV recorded 553 6-day performances in its 2025 worldwide distance table.
Calculation and scope
386 M + 167 F records.
DUV worldwide 6-day distance-table records, subject to its 45 km minimum for these timed formats; performances can include repeat runners. Not all race starts.
24-hour change from 2024 to 2025
DUV's recorded 24-hour performances increased 15.1% from 2024 to 2025.
Calculation and scope
(16,685 - 14,498) / 14,498 x 100.
Change in database counts; not a matched-race growth estimate. Coverage and backfills can change.
48-hour change from 2024 to 2025
DUV's recorded 48-hour performances increased 50.9% from 2024 to 2025.
Calculation and scope
(2,462 - 1,632) / 1,632 x 100.
Change in database counts; not a matched-race growth estimate. Coverage and backfills can change.
6-day change from 2024 to 2025
DUV's recorded 6-day performances increased 15.4% from 2024 to 2025.
Calculation and scope
(553 - 479) / 479 x 100.
Change in database counts; not a matched-race growth estimate. Coverage and backfills can change.
02 / Database analysis
Women's participation
The figures below use the F and M columns published by DUV. Each share describes recorded performances within one format; an athlete who races twice can contribute twice.
03 / Race case study
24-hour distance and age benchmarks
A complete case study: all 52 results from the September 2025 Self-Transcendence race at Battersea Park, London. Nine athletes are marked as having withdrawn early; their recorded distances remain in the analysis. This is one race, not a representative sample of all 24-hour runners.
Median distance at London 24-hour
The median distance across all 52 published London 24-hour results in 2025 was 164.4 km.
Calculation and scope
Arithmetic mean of the 26th and 27th distances in sorted order; early withdrawals retained.
All 52 published London 24-hour results, including nine marked as early withdrawals. One track race, not a worldwide benchmark.
The middle 50% of London distances
The 25th-to-75th percentile interval for London's 52 published 24-hour results in 2025 was 136.7-183.2 km.
Calculation and scope
Linearly interpolated 25th and 75th percentiles: position = (n - 1) x probability, zero-indexed (R type 7).
All 52 published London 24-hour results, including nine marked as early withdrawals. One track race, not a worldwide benchmark.
London results reaching 100 miles
31 of London's 52 published 24-hour results in 2025 (59.6%) reached at least 100 miles.
Calculation and scope
Count distances >= 160.9344 km; divide by all 52 result rows.
All 52 published London 24-hour results, including nine marked as early withdrawals. One track race, not a worldwide benchmark.
London results reaching 200 km
7 of London's 52 published 24-hour results in 2025 (13.5%) reached at least 200 km.
Calculation and scope
Count distances >= 200 km; divide by all 52 result rows.
All 52 published London 24-hour results, including nine marked as early withdrawals. One track race, not a worldwide benchmark.
Median age in the London results
The median recorded age among the 52 runners in London's 2025 24-hour result sheet was 47 years.
Calculation and scope
Median of the organizer's Age column. All 52 result rows have a recorded age.
All 52 published London 24-hour results, including nine marked as early withdrawals. One track race, not a worldwide benchmark.
London runners aged 50 or older
17 of the 52 runners in London's 2025 24-hour result sheet (32.7%) were recorded as aged 50 or older.
Calculation and scope
Count recorded ages >= 50; divide by all 52 result rows.
All 52 published London 24-hour results, including nine marked as early withdrawals. One track race, not a worldwide benchmark.
04 / Race case study
Six-day and ten-day race examples
The April 2025 Sri Chinmoy races in Queens provide complete cumulative-distance tables. The six-day event had eight women's entries and no men's entries. The ten-day event lists 25 results. These small, distinct fields describe this festival only.
Median distance in the Queens six-day field
The eight women in the 2025 Queens six-day results recorded a median 403.9 km (250.9 miles).
Calculation and scope
Median of eight final mile totals, multiplied by 1.609344. Includes the result with no additional mileage on days five and six.
One Queens race festival. Six-day sample: eight women, no men's entries. Ten-day sample: 16 men and nine women. All published totals retained.
Median distance in the Queens ten-day field
The median of the 25 published Queens ten-day results in 2025 was 812.6 km (504.9 miles).
Calculation and scope
Median of the 25 final mile totals, multiplied by 1.609344. Original distances were published to one decimal place.
One Queens race festival. Six-day sample: eight women, no men's entries. Ten-day sample: 16 men and nine women. All published totals retained.
Queens ten-day results reaching 500 miles
14 of the 25 published Queens ten-day results in 2025 (56.0%) reached at least 500 miles.
Calculation and scope
Count final distances >= 500 miles; divide by all 25 ten-day results.
One Queens race festival. Six-day sample: eight women, no men's entries. Ten-day sample: 16 men and nine women. All published totals retained.
Median change in second-half mileage
In the 25 Queens ten-day results from 2025, the median runner-level change in mileage from days 1-5 to days 6-10 was -13.1%.
Calculation and scope
For each result: ((day 10 - day 5) / day 5 - 1) x 100; then take the median. Includes pauses and early stops, not just moving pace.
One Queens race festival. Six-day sample: eight women, no men's entries. Ten-day sample: 16 men and nine women. All published totals retained.
05 / Race case study
Backyard ultra milestones
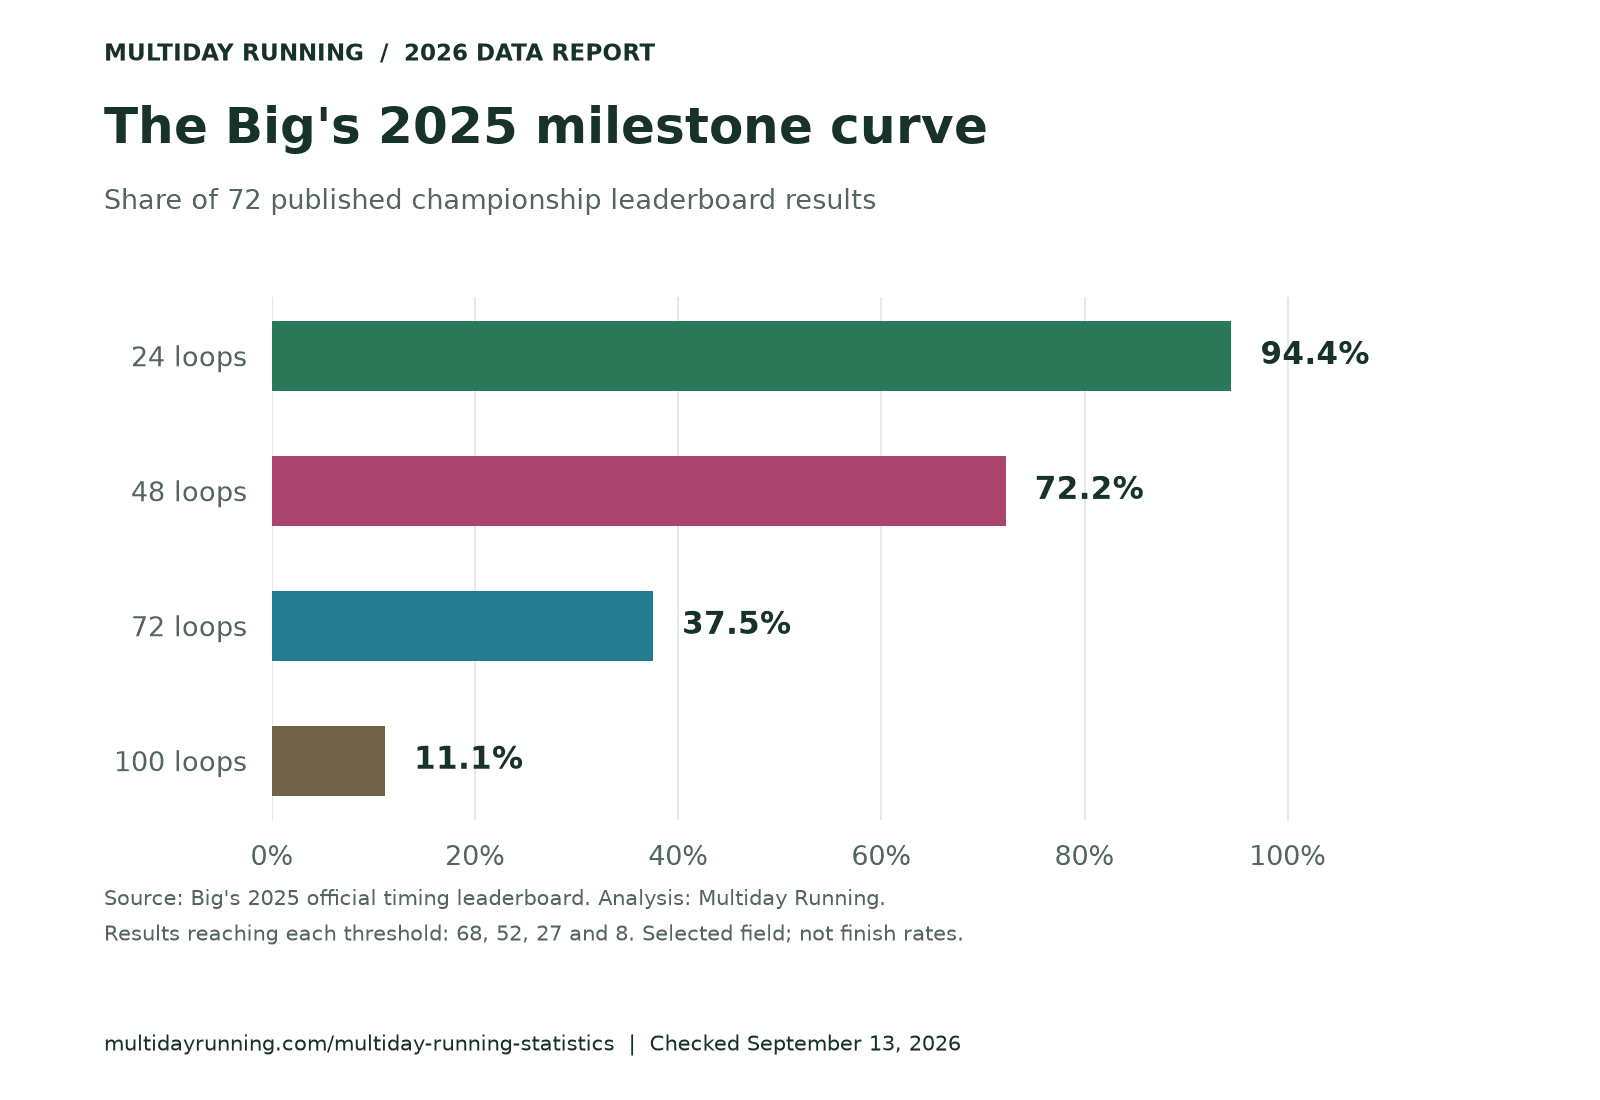
Big's 2025 was a selected world-championship field. The timing provider's leaderboard displays 72 results with a recorded first loop. All calculations use those 72 rows, not the advertised field or entry list. Completed loops remain meaningful even when an athlete is classified as DNF.
Median completed loops at Big's
The median completed-loop total in the 72 published Big's Backyard Ultra 2025 leaderboard results was 62.5.
Calculation and scope
Median of the timing provider's NumberOfLaps field. Loop totals retained for athletes classified as DNF.
72 published Big's 2025 leaderboard rows with a recorded first loop. Selected championship field; not all entrants or typical backyard runners.
Big's results reaching 24 loops
68 of the 72 published Big's Backyard Ultra 2025 leaderboard results (94.4%) recorded at least 24 completed loops.
Calculation and scope
Count NumberOfLaps >= 24; divide by the 72 displayed leaderboard rows. This is a milestone share, not a finish rate.
72 published Big's 2025 leaderboard rows with a recorded first loop. Selected championship field; not all entrants or typical backyard runners.
Big's results reaching 48 loops
52 of the 72 published Big's Backyard Ultra 2025 leaderboard results (72.2%) recorded at least 48 completed loops.
Calculation and scope
Count NumberOfLaps >= 48; divide by the 72 displayed leaderboard rows. This is a milestone share, not a finish rate.
72 published Big's 2025 leaderboard rows with a recorded first loop. Selected championship field; not all entrants or typical backyard runners.
Big's results reaching 72 loops
27 of the 72 published Big's Backyard Ultra 2025 leaderboard results (37.5%) recorded at least 72 completed loops.
Calculation and scope
Count NumberOfLaps >= 72; divide by the 72 displayed leaderboard rows. This is a milestone share, not a finish rate.
72 published Big's 2025 leaderboard rows with a recorded first loop. Selected championship field; not all entrants or typical backyard runners.
Big's results reaching 100 loops
8 of the 72 published Big's Backyard Ultra 2025 leaderboard results (11.1%) recorded at least 100 completed loops.
Calculation and scope
Count NumberOfLaps >= 100; divide by the 72 displayed leaderboard rows. This is a milestone share, not a finish rate.
72 published Big's 2025 leaderboard rows with a recorded first loop. Selected championship field; not all entrants or typical backyard runners.
Under the official backyard rules, every athlete except the winner is technically DNF. A completed-loop threshold measures performance within that format; it is not a conventional finish rate.
Championship context / Updated
2026 Backyard Ultra World Team Championship
The 2026 team edition started on . National teams competed at satellite races in their own countries, with synchronized starts. The final site ended on October 22. Of 67 starting teams, the United States won with 1,120 team yards, and Belgium’s Merijn Geerts and Ivo Steyaert set the backyard world record of 124 yards. This is a team competition across separate courses, not a single-field individual championship.
- 15 team places
- Each national team has 15 places. Every member scores: one completed yard (loop) adds one point, and the highest total wins the team title. Official format and scoring.
- 68 entries in the pre-race listing
- Our count of the national-championship entries dated October 17, 2026 on the organizer's 2027 qualifying page, checked October 16, 2026. This historical listing is different from the 67 teams recorded as starting; it must not be used as the starter count.
A benchmark from the 2024 team edition
Merijn Geerts, Ivo Steyaert and Frank Gielen of Belgium each completed 110 yards in the official 2024 World Team Championship results. That is a historical team-edition benchmark, not a current world-record claim. The 2025 Big's statistics above describe the separate individual championship and a different field.
These event facts are separate from the 25 numbered statistics and their CSV/JSON downloads. For athlete selections and reserves, consult the official 2026 roster; a pre-race selection is not a recorded start.
Full 2026 championship guideThe underlying numbers
Data tables
| Format | 2024 | 2025 | Change | F records, 2025 |
|---|---|---|---|---|
| 24-hour | 14,498 | 16,685 | +15.1% | 4,909 |
| 48-hour | 1,632 | 2,462 | +50.9% | 838 |
| 6-day | 479 | 553 | +15.4% | 167 |
Source: DUV worldwide distance table. Snapshot checked September 13, 2026. Changes are not adjusted for race coverage.
| At least | Results | Share of 72 |
|---|---|---|
| 24 loops | 68 | 94.4% |
| 48 loops | 52 | 72.2% |
| 72 loops | 27 | 37.5% |
| 100 loops | 8 | 11.1% |
Source: official timing leaderboard. Thresholds overlap: a result above 100 loops also reaches the lower thresholds.
Definitions and limits
Methodology
All 25 findings are calculations from published data. Three add DUV's M and F counts; the other 22 calculate changes, shares, medians or quartiles. The edition date is September 13, 2026; the race data covers 2025, with 2024 comparisons for DUV. No partial 2026 race totals enter the analysis.
What is counted
DUV observations are performances in its worldwide distance table. They are not deduplicated people, a count of race starts, or a census of all events. The database's separate runner-summary table has a different total and is not combined with the distance table here. The three formats do not cover all multiday running: stage races, 200-mile races and other durations are outside this aggregate comparison.
DUV's inclusion criteria require at least 45 km for the timed formats used here. Performances below that threshold are excluded by the database. The London case study, in contrast, retains every row in the organizer's table, including its 36 km result. These datasets therefore have different inclusion rules.
The four event fields were selected because complete published tables were accessible. London contributes 52 results; Queens contributes eight six-day results and 25 ten-day results; Big's contributes 72 displayed leaderboard rows. These are convenience samples, not a random or representative selection. They are not pooled with each other or added to DUV totals.
How calculations work
Percent changes use (2025 count - 2024 count) / 2024 count. Category and milestone shares use the numerator and denominator stated beside each finding. Medians use the middle observation, or the mean of the two middle observations. Quartiles use linear interpolation at (n - 1) x probability. Each observation receives equal weight.
London distances use the organizer's kilometre column. Queens distances use the published cumulative mile totals; kilometre conversions use exactly 1.609344 km per mile. The organizer's 2025 runner profile corroborates the mile units. Source precision is retained for calculations; displayed distances and percentages are rounded to one decimal place.
The ten-day second-half comparison subtracts each runner's day-five cumulative mileage from the final total, compares it with that runner's first five days, then takes the median percentage change. This includes resting, walking and stopped participation. It is not a measurement of moving speed or evidence about what caused a change.
Missing data and classification
All London distances and ages are present. Its nine marked early withdrawals remain included. Queens final totals remain included even when later daily mileage is zero. Big's timing view filters for a recorded first loop and its configured result statuses; the report uses the 72 displayed rows and makes no assumption about the remaining entrants.
Category labels follow the sources. No identities or missing categories are inferred. Comparing category shares across different sources, years or selected race fields does not establish a worldwide difference. Database backfills, race selection, conditions and course changes can all affect comparisons.
Edition history
: source recheck and independent recalculation of all 25 findings. All displayed values are unchanged. This revision corrects Big's end date in the downloadable metadata from October 22 to October 23, 2025, labels the three DUV totals as sums of source counts, and adds the 45 km inclusion threshold. The corrected end date is inferred from the timing provider's announced start time and final-loop record.
A separate 2026 championship context section was added on September 13, 2026. Its listing count was rechecked on October 12, 2026, when Benin, Russia and Zimbabwe no longer appeared, followed later that day by Botswana, Cyprus and Kazakhstan (74 to 68 entries). The count was unchanged on October 16, 2026. The context was updated after the race on October 23, 2026. Those event updates and the historical listing count do not change the frozen 25-statistic dataset.
: first edition, now superseded. Its dated JSON and CSV downloads still carry the uncorrected October 22 end date and are now marked with a supersededBy field and a correction note rather than being rewritten. Dated downloads retain their edition's inputs and calculations. Corrections can be sent to hello@multidayrunning.com.
For writers and editors
Cite this report
Multiday Running Editorial Team (2026-09-13). 25 Multiday Running Statistics for 2026. Original calculations from DUV and official race results. https://multidayrunning.com/multiday-running-statistics
When using a calculation, credit Multiday Running's analysis of DUV or the named organizer's results. Keep the event, year and sample scope with the number. The three format totals are our additions of DUV's published M and F counts; credit DUV for those component counts. Each numbered finding has its own permanent link.
Our original charts and analysis may be reproduced with attribution and a link to this report. The underlying publishers retain their rights in their own result tables and materials.
Press enquiries and data questions: hello@multidayrunning.com.
Sources
- DUV annual statistics
Worldwide distance-table cells, 2024 and 2025. M and F columns; database snapshot reviewed September 13, 2026.
- London 24-hour: official results
Both PDF pages, ranks 1-52, September 20-21, 2025. Distances, ages and withdrawal footnote.
Organizer's event report - Queens 6-day and 10-day: official results
PDF pages 1-3, April 2025. Eight women's six-day results and 25 ten-day results. Cumulative distances are in miles.
Organizer's event report - Big's 2025: official timing leaderboard
Live Leaderboard view, retrieved after the event: all 72 displayed result rows. Completed-loop field; the configured filter excludes entrants without a recorded first loop.
Additional references: DUV inclusion criteria; Backyard Ultra rules; Queens mileage corroboration.